


Introduction: Why Traditional Metrics Are Failing
For decades, the debt-to-GDP ratio has served as the North Star for policymakers and economists measuring national economic health. But today’s financial system no longer operates on traditional principles of debt extinguishment. Instead, it thrives on constant debt refinancing. As a result, debt-to-GDP has become a misleading compass, blind to the real forces at play.
Economist Michael Howell of CrossBorder Capital proposes a new analytical framework: the Debt-to-Liquidity ratio. Unlike debt-to-GDP, this metric focuses on the system’s capacity to refinance obligations through available liquidity. Howell’s research argues that liquidity, not output, is now the ultimate stabilizer of the modern economy. And alarmingly, current liquidity trends suggest we are headed straight for a crisis if decisive action isn’t taken soon.
Foundations of Howell’s Framework
Debt Extinguishment vs. Debt Refinancing
In traditional economic models, debt is gradually paid off through economic growth and budget surpluses. Today, however, debt is seldom extinguished; it is perpetually rolled over. Howell asserts that systemic liquidity is the oxygen that allows this constant refinancing cycle to continue. Without sufficient liquidity, debt markets freeze, funding gaps widen, and financial systems break down.
The Critical Metric: Debt-to-Liquidity
Howell's Debt-to-Liquidity ratio measures total debt against the domestic liquidity stock (e.g., M2 money supply). His empirical work shows that once the Debt-to-Liquidity ratio breaches 210%, financial crises become not just likely, but inevitable. Historical case studies—from the Great Financial Crisis to the Eurozone debt collapse—support this assertion. Howell’s insight is clear: contemporary economic crises are fundamentally liquidity crises.
Where We Stand Today
Current projections indicate that the Debt-to-Liquidity ratio is rising sharply, poised to breach critical stress thresholds by the end of 2025. This signals not just elevated risk but an urgent call to action for monetary authorities, particularly the Federal Reserve.
Visual Proof: Charts That Tell the Story
1. Debt-to-Liquidity Ratio Chart
The Debt-to-Liquidity ratio is surging toward the 210% "refinancing tension" line.
Historical crises neatly coincide with similar breaches.
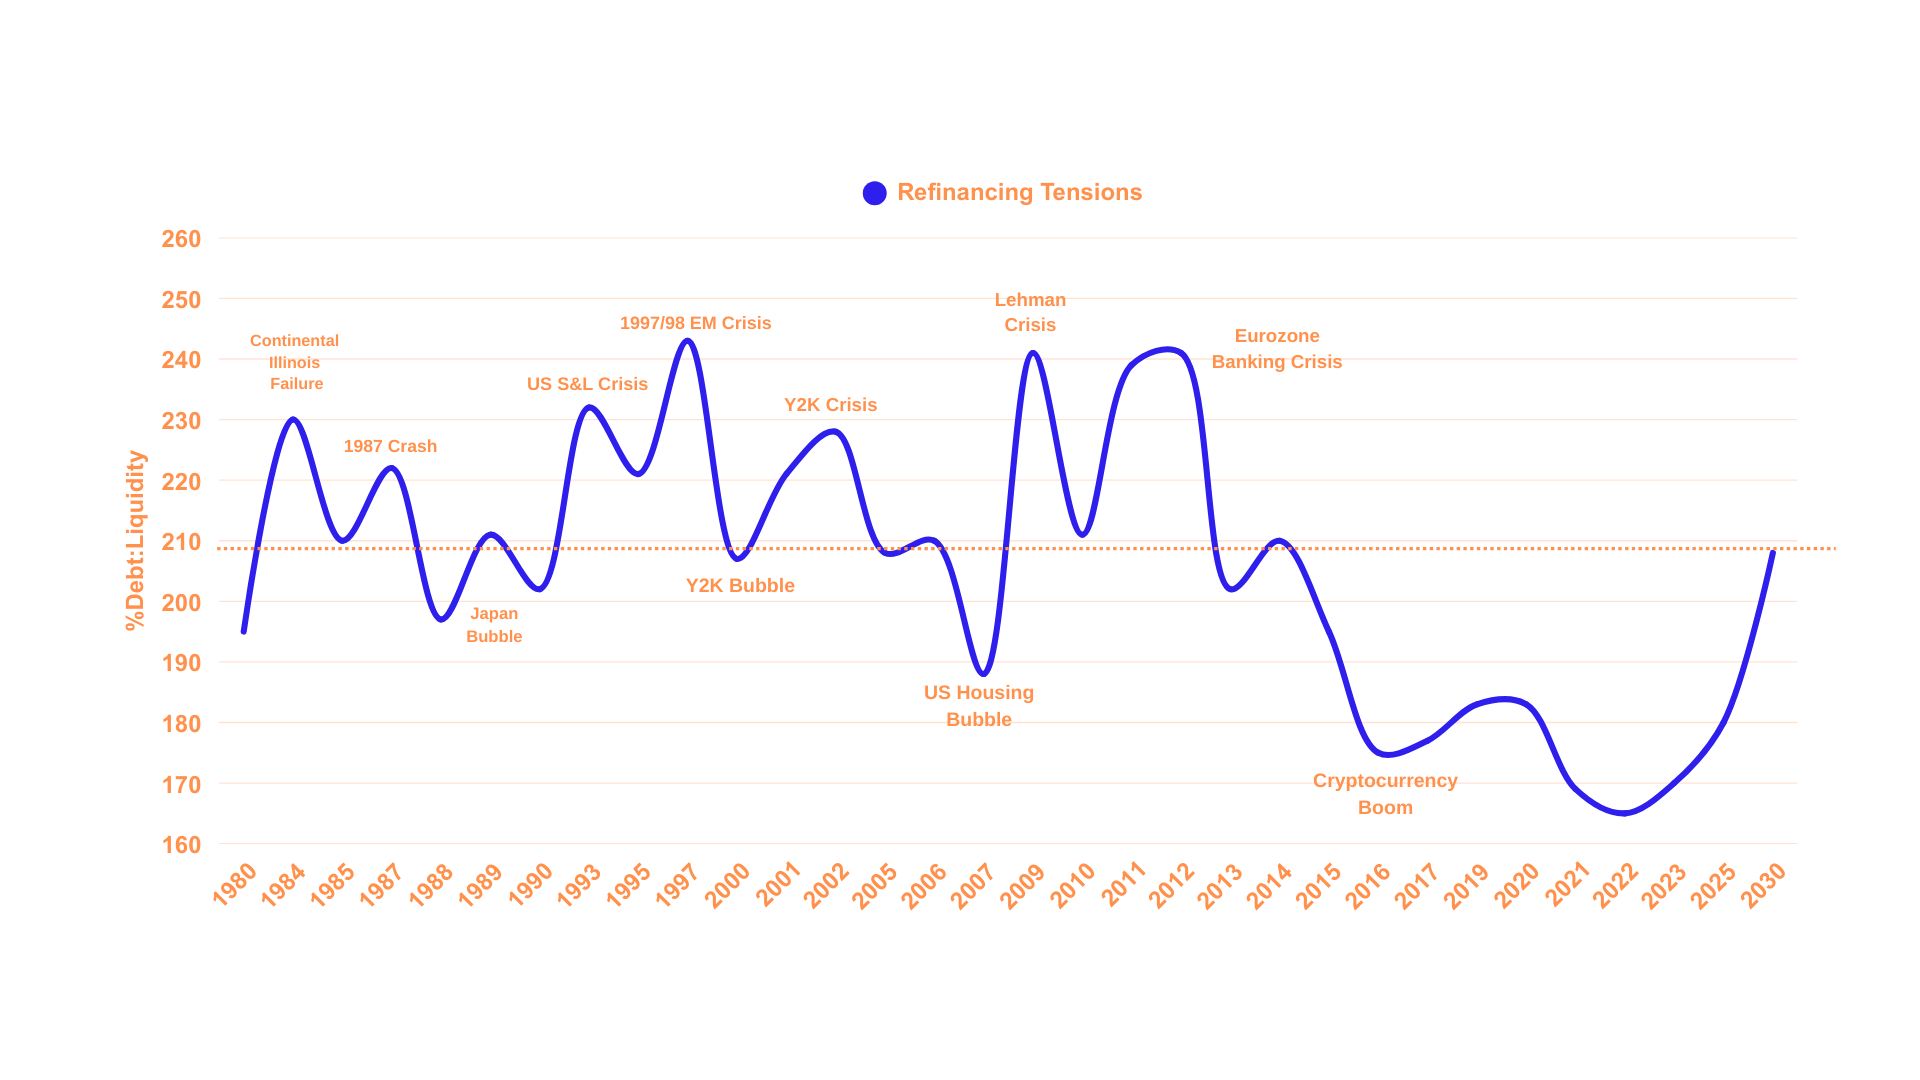
Chart 1: Debt-to-Liquidity Ratio nearing critical stress thresholds historically associated with financial crises
2. Collateral Shortage (SOFR – Fed Funds Spread)
Persistent spikes signal acute stress in the repo markets, the heartbeat of liquidity.

Chart 2: Persistent SOFR-Fed Funds spread spikes signal mounting repo market collateral stress.
3. US Bank Reserves vs. Adequacy Levels
Bank reserves are projected to fall below safe thresholds by late 2025.

Chart 3: Board of Governors of the Federal Reserve System (US), Liabilities and Capital: Other Factors Draining Reserve Balances: Reserve Balances with Federal Reserve Banks: Week Average [WRESBAL], retrieved from FRED, Federal Reserve Bank of St. Louis; https://fred.stlouisfed.org/series/WRESBAL
4. Treasury Convexity and Corporate Credit Spreads
Widening spreads between AAA and single-B rated bonds point to escalating credit risks.

Chart 4: Corporate spreads relative to the US 10Y treasury yields; Federal Reserve Bank of St. Louis, Moody's Seasoned Baa Corporate Bond Yield Relative to Yield on 10-Year Treasury Constant Maturity [BAA10Y], retrieved from FRED, Federal Reserve Bank of St. Louis; https://fred.stlouisfed.org/series/BAA10Y
5. World Financial System Diagram
Howell's framework explains why modern systems are collateral- and liquidity-driven, not output-driven.

Chart 5: Howell’s global liquidity framework: traditional banking and shadow banking diverge around a stressed repo system.
Each chart builds on the last, forming an airtight case: the system is increasingly fragile, and liquidity, not rate cuts alone, must be the policy priority.
Source: Data adapted from CrossBorder Capital research, Blockworks’ “Forward Guidance” podcast, Federal Reserve System, and public datasets.
Why the Current System is Failing
Despite the Federal Reserve's well-telegraphed quantitative tightening (QT) efforts and interest rate hikes, the intended contractionary effects have been partially neutralized by hidden liquidity injections. Howell identifies multiple underappreciated dynamics at play:
Reverse Repo Facility (RRP) Runoff: As RRP balances decline, liquidity re-enters the financial system.
Treasury General Account (TGA) Drawdowns: Treasury spending from its cash reserves releases liquidity.
Federal Reserve Operating Losses: Deferred asset accumulation by the Fed keeps reserves higher than headline QT suggests.
These offsetting flows have created a confusing environment where financial conditions remain looser than traditional models predict. Howell’s insight is pivotal: monetary tightening, in isolation, is no longer a reliable indicator of liquidity conditions.
The Impending Crisis
CrossBorder Capital’s multivariate analysis shows that the synchronized tapering of Treasury bill issuance and the winding down of special liquidity programs have caused liquidity conditions to deteriorate rapidly by mid-2025. Critical stress signals are flashing:
Repo markets are under strain, as indicated by persistently elevated SOFR spreads.
Bank reserves are nearing inadequate levels.
Global GDP growth projections have slumped to near zero.
If unaddressed, Howell projects that a systemic liquidity event is likely to unfold by Q4 2025, requiring emergency intervention. Given the shocks that the Trump Tariffs have brought to the system after Howell compiled this analysis (March, 2025), this author’s opines that the liquidity event Howell anticipates is now accelerated into Q2-Q3 2025.
The Policy Response: What Must Be Done
Howell’s prescription is unequivocal: the Federal Reserve must expand its balance sheet—effectively reintroducing quantitative easing (QE) or a functional equivalent.
Options include:
Direct asset purchases from the secondary market.
Enhancing standing repo facilities.
Introducing new liquidity support programs modeled after BTFP.
Importantly, Howell anticipates that any new liquidity injection will be politically rebranded to avoid the stigma of "QE," but functionally, it will amount to the same lifeline.
The need is not ideological; it is mechanical. The system’s dependence on continuous refinancing makes sustained liquidity injections a necessity for stability.
Strategic Investment Implications
Investors must prepare for an environment characterized by severe liquidity constraints followed by aggressive central bank interventions. Strategic positioning includes:
Gold and Bitcoin: Proven hedges against liquidity crises and fiat devaluation.
Chart 6: USD/ChineseYuan; Gold/USD; Gold/ChineseYuan Equilibrium right about $3,330/$24,300/$7.35—currently the dollar need only slide 5 cents more against the Yuan….
Chart 7: Bitcoin/USD; Gold/USD—% change since 2017
Selective Credit Exposure: Favor higher-quality credits while monitoring spreads closely.
Stablecoins and Short-Duration Assets: Instruments closely tied to high-quality collateral provide defensive yield.
Wholesale portfolio shifts are unnecessary—measured, strategic allocations will best capture upside while mitigating systemic risks.
Conclusion: A New Macro Reality
Michael Howell’s Debt-to-Liquidity framework is not merely a provocative academic exercise. It provides an essential lens for understanding the evolving macroeconomic landscape. As modern economies become increasingly reliant on refinancing rather than repayment, liquidity emerges as the critical variable for stability.
Policymakers must recognize this shift. Without proactive liquidity support, financial conditions could tighten beyond sustainable levels by late 2025, raising the risk of systemic stress. A measured, timely policy response will be crucial to mitigating these risks and sustaining long-term economic resilience.


Share this post