


Deciphering the Markets: Insights for Smart Investing
Deciphering the Markets: Insights for Smart Investing
Navigating Financial Waters: A Strategic Guide for Growth and Tax Optimization

The Federal Reserve and Your Portfolio
Welcome to the latest insight from Asset Guidance Group, LLC, where we simplify the complexities of investing for our esteemed clients and potential new clients concerned with tax-optimized retirement planning, and strategic growth. Today, we're delving into a topic that's crucial for anyone looking to make informed decisions about their retirement accounts and investment strategies: the relationship between the bond markets, the Federal Reserve, and the stock markets.
Understanding the Currents on these Seas
Since the 2008 Global Financial Crisis, the Federal Reserve has taken significant steps to stimulate the economy. By slashing short-term interest rates to nearly zero and launching a strategy known as "quantitative easing" (QE), the Fed aimed to lower long-term interest rates. This involved purchasing massive quantities of long-term Treasurys and mortgage-backed securities, expanding the Fed's balance sheet dramatically.1

This move led to a widespread belief: with diminished yields in fixed-income markets, investors were seemingly pushed towards riskier assets, including stocks. This influx of easy money did indeed boost capital flows into the stock market, as investors with substantial investable assets seeking avenues for growth or search of yield found limited options in the bond market.
The consensus was clear: as yields in fixed-income markets dwindled, the allure of stocks grew. This phenomenon saw a surge in capital flow towards riskier assets, a move that seemed to benefit portfolios during times of "easy money."
Dispelling Myths, Embracing Reality
There's a narrative that suggests the Fed's actions were the sole driver of the stock market's success in the 2010s and beyond 2020. However, this viewpoint doesn't hold up under scrutiny. In fact, upon closer examination, it turns out to be a gross over-simplification. If that narrative were accurate, the reverse process—quantitative tightening (QT) and rising interest rates— would theoretically harm stock prices and we'd expect to see a corresponding downturn in stock performances, if such Fed actions were purely detrimental. Yet, this hasn't been the case.
Despite the Fed's balance sheet peaking in April 2022 and subsequently shrinking by nearly $1.5 trillion, and bond yields climbing significantly, the stock market has shown remarkable resilience. Even during periods of aggressive rate hikes and rising bond yields, the market has continued to rally, hitting new all-time highs in 2024.2

The preceding statement is graphically shown by the area in the upper right corner of the above chart designated by the square. The downward sloping line is the size of the Fed’s balance sheet while the upward trending line is the NASDAQ index.
For those managing sizable investable assets and keen on tax-optimized retirement planning, this insight is invaluable. The stock market's vitality, reaching new heights even in 2024, underscores the multifaceted drivers of market performance.3

Note in the above chart how the NASDAQ, Dow Composite, and S&P 500 all continued to rally through the Fed’s rate hikes and while the Fed maintained high rates (comparatively) while the US10-Year Yields rose also.
The Bigger Picture
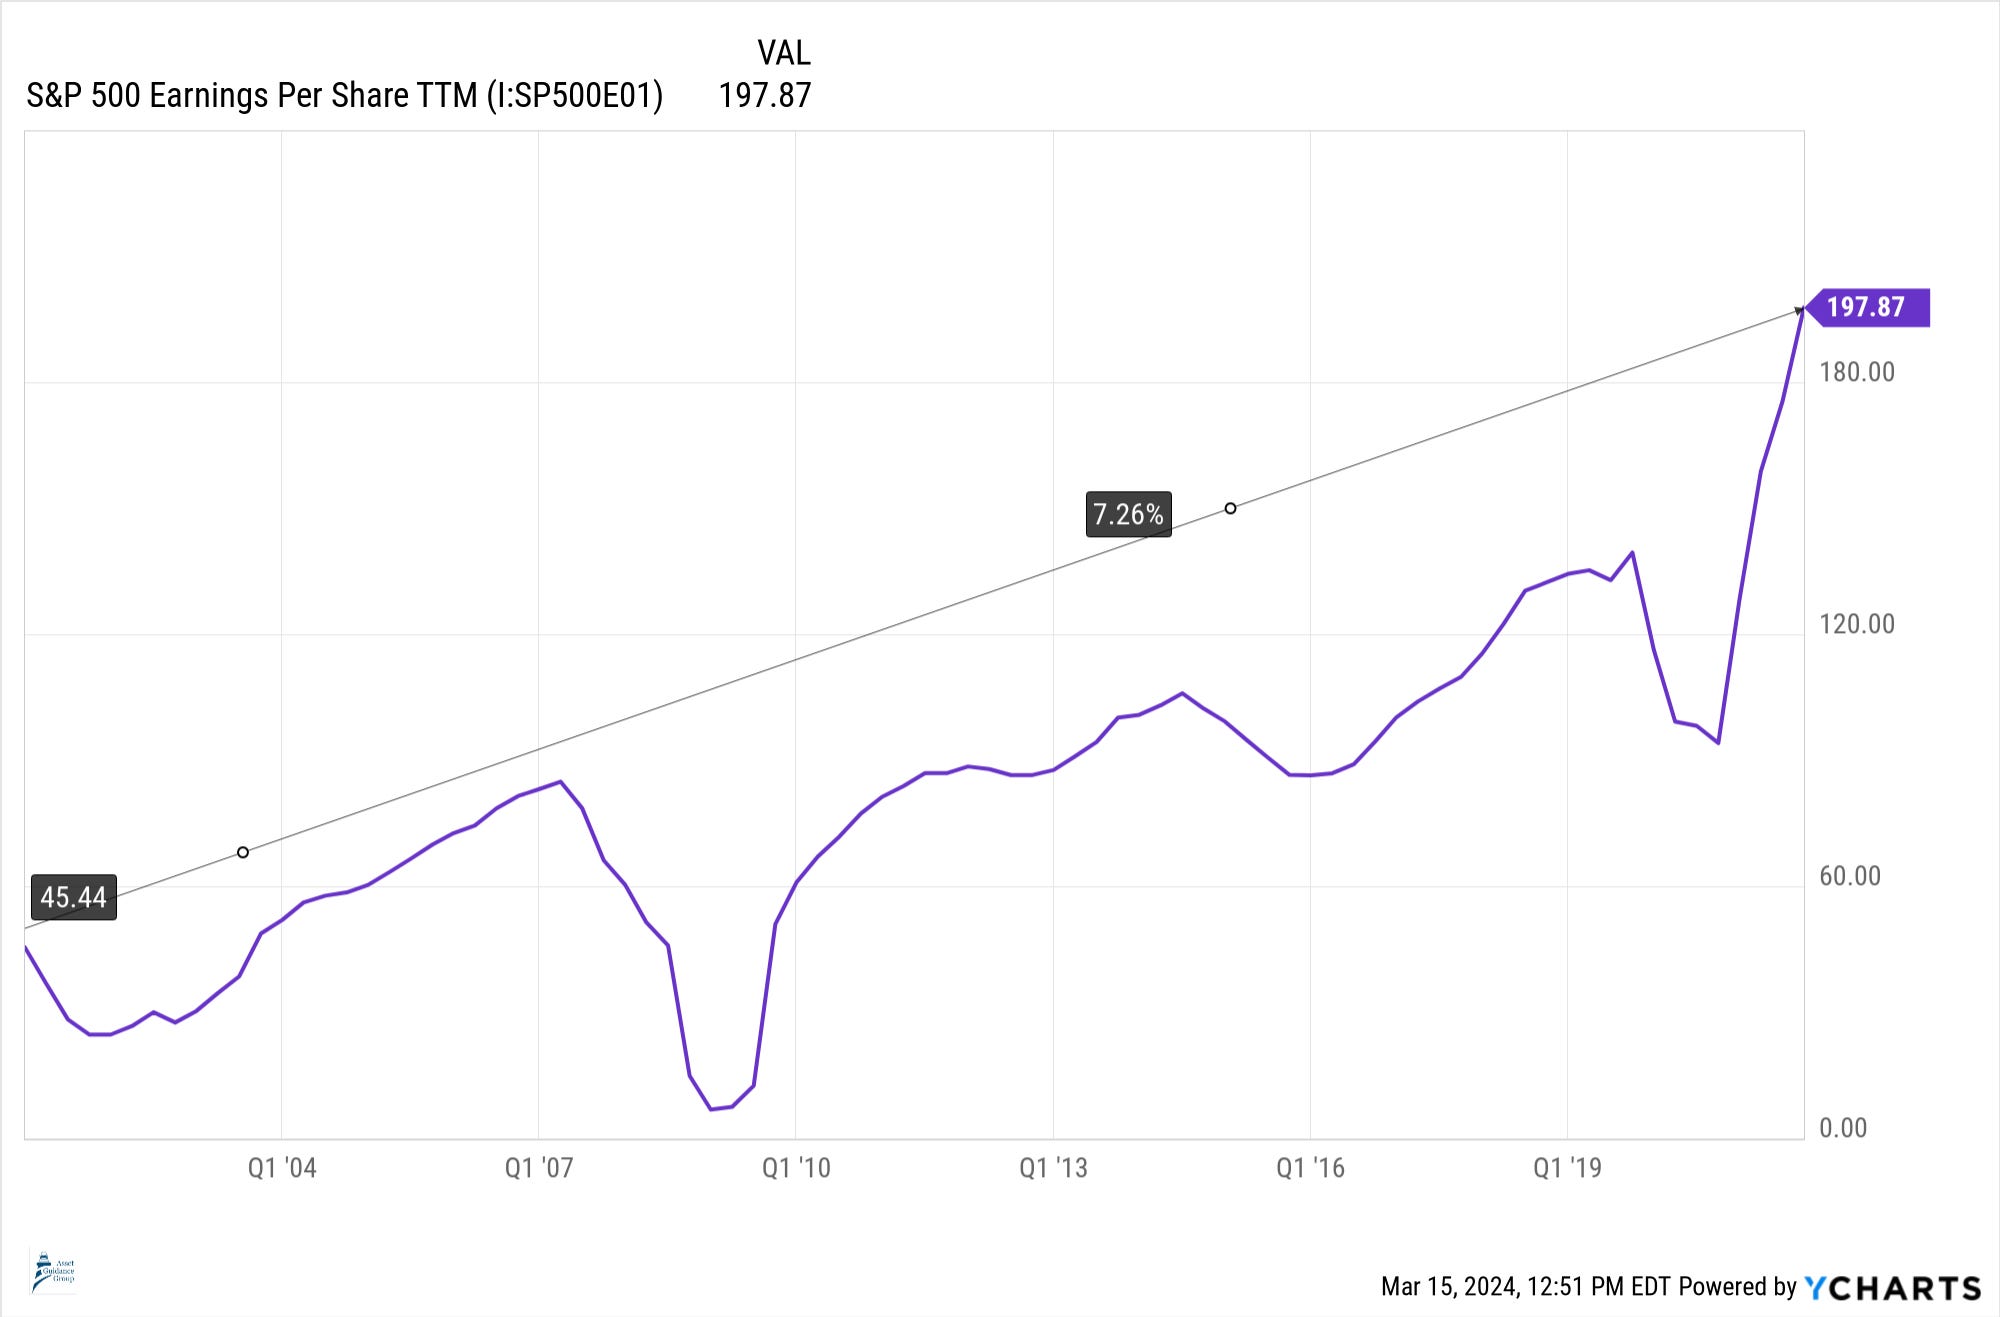
What this tells us is that the stock market's performance is influenced by factors beyond just the Fed's policies or bond yields. A key component often overlooked is the role of corporate earnings and economic growth. From 2009 to the end of 2019, we saw a steady increase in S&P 500 earnings per share (EPS), with profits reaching their highest levels in decades by 2022.4 This growth aligns closely with the S&P 500's annualized return from 2001-2022, emphasizing that stocks are propelled by more than just monetary policy.5

The above-chart shows corporate earnings and growth grew steadily until 2015, pulled back somewhat, then continued their rise until the Pandemic. Then, they resumed from 2021’s reopening of the economy to 2022.
The below-chart shows the compound annual growth rate for the S&P 500’s aggregate earnings per share to be 7.26%. The annualized return for the 20-year period 7.92%. 6
Key Strategies for the Informed Investor
For individuals, couples, and small businesses with an eye towards tax-optimized growth in their retirement accounts, the lesson is clear: while the Federal Reserve and bond yields play significant roles in the financial markets, they are not the sole drivers of stock market performance. The underlying economic health and corporate earnings are equally, if not more, important factors to consider. Thus, a strategic approach that transcends the immediate reactions to Federal Reserve policies, focusing instead on long-term economic fundamentals and corporate performance, is crucial.
As we navigate the complexities of the investment landscape waters together, remember that a well-informed strategy, focusing on long-term growth and diversification, is key to achieving your financial goals. At Asset Guidance Group, LLC, we're here to provide the insight and expertise you need to make the most of your investable assets. Together, let's embrace a future where informed decisions and strategic planning lead to enduring prosperity and financial security.
Assets: Total Assets: Total Assets (Less Eliminations from Consolidation): Wednesday Level | FRED | St. Louis Fed (stlouisfed.org) US 10Y -vs- NASDAQ, Dow Jones Composite, & S&P 500 Indexes Nov 2019-Mar 14, 2024.