

All-Time Highs, Almost Alone
The indexes are at record highs. The internals aren’t. Here’s what the data actually says — and why retirement money cannot afford to confuse the two.


Two things have been true at the same time, and they don’t quite fit together.
The S&P 500 has been printing record highs. The Nasdaq-100 has done the same. This has happened more than ten weeks into an Iran war that began with U.S. strikes on February 27, with oil above $100 a barrel, the Strait of Hormuz effectively closed to commercial shipping, and a Federal Reserve that has refused to cut rates into a softening economy. None of that has stopped the headline numbers.
The simple read is that the market has decided the war doesn’t matter and the macro picture is fine. The data tells a more complicated story.
Beneath the indexes, fewer and fewer stocks have been doing the work. Sector returns have spread apart in ways you don’t usually see in a healthy rally. Earnings upgrades have concentrated in a handful of names. And one of the biggest forces lifting the index over the last several weeks may not have been broad investor buying at all — it may have been the mechanics of the options market.
I want to walk through what the actual numbers say. Then I’ll come back to why this matters more for someone in the fragile decade than for almost anyone else — and why our investment design was built for exactly the kind of market we just lived through.
The Equal-Weight Gap
Start with the simplest test of breadth — that’s the term for how many stocks are participating in a rally.
Most people know the S&P 500 as a single number. What they don’t always realize is that the 500 stocks inside it are not weighted equally. The biggest companies — Apple, Microsoft, Nvidia, Amazon, Meta, Alphabet, and a handful of others — count for a much larger share of the index than the smaller names. When those mega-cap stocks rise sharply, the headline index rises sharply, even if most of the other 490-something stocks are flat or falling.
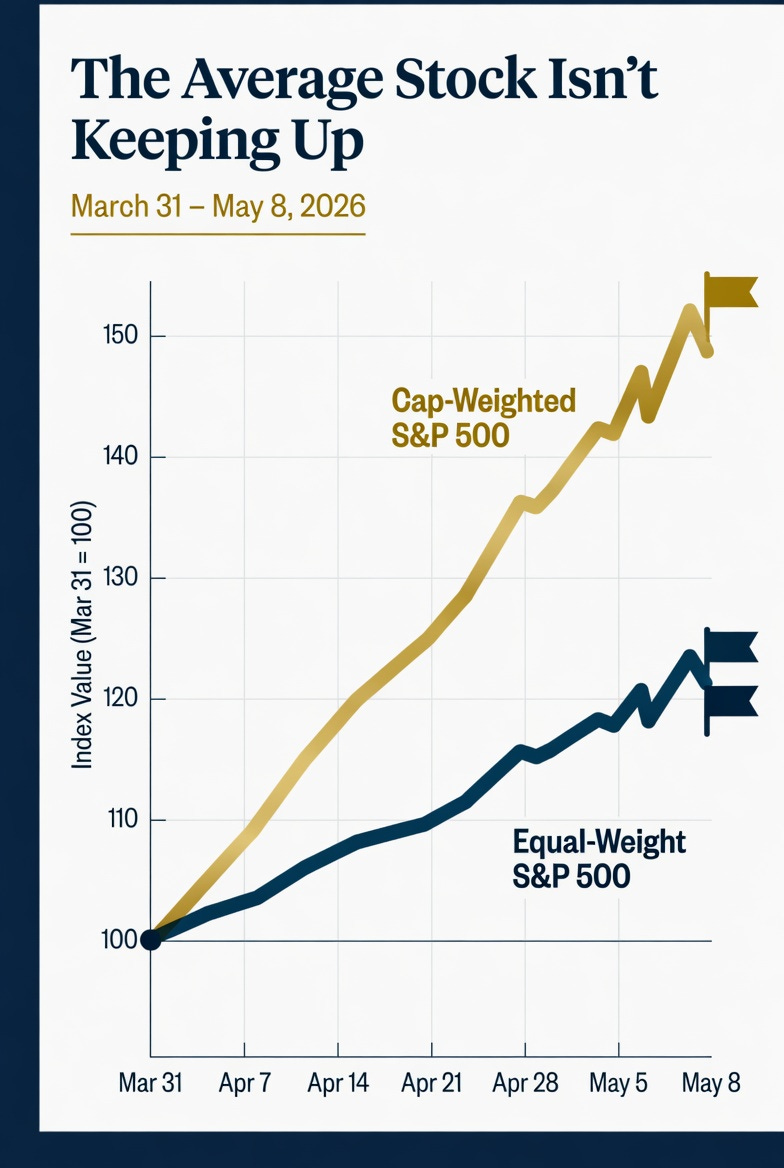
The clean way to see what the average stock is doing is to look at the equal-weight version of the same index. The equal-weight S&P 500 — it trades under the ticker RSP — treats every component the same. If both versions are rising together, the rally is broad. If the headline index is up and the equal-weight version isn’t, the gain is being carried by a small group of stocks.
From March 31 through May 8, the cap-weighted S&P 500 (SPY) gained 13.4%. The equal-weight version (RSP) gained 6.4%. Less than half.
The Nasdaq-100 told the same story. Cap-weighted (QQQ): up 23.2%. Equal-weight (QQQE): up 15.8%.
CNBC reported a similar gap in April alone — the S&P 500 rose more than 10% while the equal-weight version managed only about 6%. Wolfe Research’s Rob Ginsberg described the market as “narrow,” dominated by high-performing momentum stocks. Goldman Sachs found that breadth had fallen to one of its narrowest readings since the dotcom era of the late 1990s.
This is not by itself a reason to sell. It is a reason to know what you actually own when you own “the market.”
Where the Gains Came From
The concentration story gets sharper when you look inside the index.
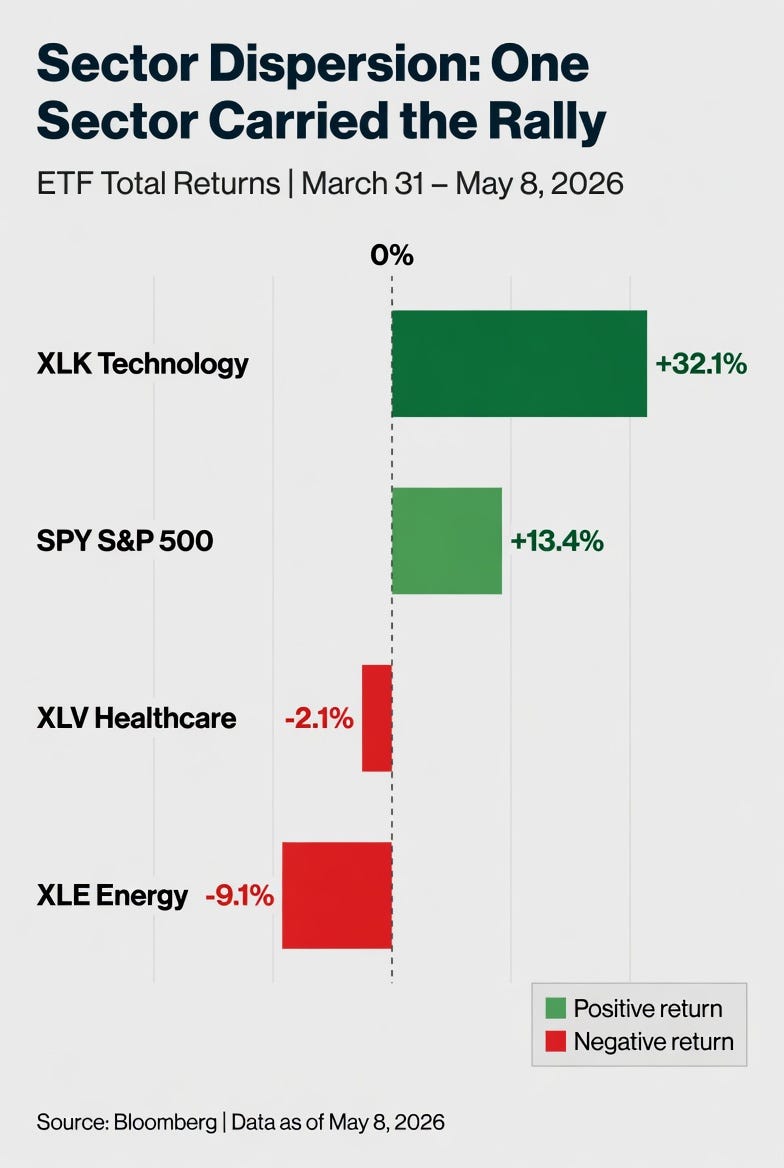
Technology has carried the rally. The technology sector ETF (XLK) gained 32.1% from March 31 through May 8. Over the same period, the healthcare sector (XLV) lost 2.1%. Energy (XLE) lost 9.1%. The Dow Jones Industrial Average — which is heavier in industrial and consumer companies and lighter in tech — gained only 7.1%.
That kind of sector dispersion is not normal in a confident, broad-based bull market. In a confident rally, most sectors move up together. Here, technology was running a sprint while two major sectors were going backwards.
Earnings forecasts told the same story. Business Insider reported that 85% of the recent upward revisions to S&P 500 earnings estimates were concentrated in just four companies: Micron, Exxon Mobil, Chevron, and Broadcom. CNBC’s summary of JPMorgan’s trading-desk work found that the largest technology companies’ earnings were beating the other 493 stocks in the index by roughly 42%.
Ameriprise added a final piece. As of mid-April, only about half of S&P 500 stocks were trading above their 50-day moving averages — a basic measure of short-term trend health. Back in January, when the index was also at records, that figure was closer to two-thirds. The index was higher. The percentage of stocks participating was lower.
Read those three findings together. Technology carrying the index. Earnings revisions stacked into four tickers. Half the index trading below its short-term trend even at all-time highs. That is the signature of a narrow rally — not a confident one.
The Options Story
The third piece of evidence is the strangest, and it requires a quick definition.
A call option is a contract that lets the buyer benefit if a stock or index goes up, without having to buy the underlying shares directly. Big institutional investors use options for all kinds of reasons — to speculate, to hedge a position, to manage exposure efficiently. When the people who sell those options (called dealers) take the other side of the trade, they often have to buy or sell the underlying market to manage their own risk.
Here’s the part that matters. When call buying is heavy and one-sided, dealers can end up in a position where they have to buy the index as it rises and sell as it falls — not because they want to, but because they’re hedging. That mechanical demand can lift the index higher than ordinary investor buying alone would justify. Reuters has reported on this dynamic as a recurring feature of the current market cycle.
What’s been happening recently is unusual in size.
Morningstar/MarketWatch flagged a chart this week showing roughly $2.6 trillion of notional S&P 500 call-option buying in a single Wednesday session. Commentators in the article described it bluntly: “the option tail is wagging the equity dog.” Cboe’s own April release confirmed the broader context, including a single-day record of 6.7 million S&P 500 options contracts traded on April 17, and a separate Cboe proprietary index-options record on April 14.
The implication is uncomfortable. A meaningful share of the index’s recent strength may not reflect investors collectively deciding that 500 American companies are worth more. It may reflect aggressive call buying creating mechanical demand at the index level — demand that can reverse just as mechanically when the call buying fades, when implied volatility resets, or when positioning gets flushed out around an options expiration.
Options demand is bullish. It is not the same thing as broad accumulation.
What the Bulls Have Right
I want to be fair to the bullish view because it isn’t crazy.
Goldman Sachs has called for the S&P 500 to reach 7,600 by year-end, citing 12% earnings growth in 2026, a record $422 billion of buyback authorizations, and the AI capital-spending wave. JPMorgan Asset Management has argued that geopolitical shocks usually fade for U.S. equities unless they transmit through energy markets — and the U.S., as a net energy exporter, is far less oil-intensive than it was during prior shocks. The Associated Press reported that early Q1 earnings have been strong, with most companies beating expectations.
And the rally hasn’t been confined entirely to mega-cap tech. The small-cap Russell 2000 (IWM) actually outperformed the S&P 500 over the same period — up 14.6% versus SPY’s 13.4%. That complicates any clean “only the giants are working” story.
Both readings can be true at once. The market has rational reasons to rise. The participation has also been genuinely uneven. Goldman, JPMorgan, CNBC, Ameriprise, and several others have made variations of the same point: bullish but fragile. The earnings story is real. The leadership concentration is also real. Either one could resolve before the other does.
“But the Market Always Climbs a Wall of Worry”
Anyone who has watched markets for any length of time has heard the phrase, and there is real truth in it. Markets have made all-time highs through wars, oil shocks, banking crises, pandemics, political crises, and more episodes of “this time it’s different” than anyone can count. Every chart of the S&P 500 over the last seventy-five years tells the same story: red arrows on the way down at every crisis, and a long green line that eventually pushes through every one of them. Pessimism, as an investing posture, has a terrible long-run record.
So why not just stay long the index, ride out the noise, and trust the climb?
Two reasons.
The first is that “the market always climbs a wall of worry” is true on a long enough timeline. It is not a statement about the next twelve months. The climb has included peak-to-trough drawdowns of roughly 49% in 2000–2002, roughly 57% in 2007–2009, and roughly 34% in 2020, with several smaller bear markets in between. Each of those took years to fully recover when measured in real terms. The historical record vindicates patience over decades. It does not vindicate complacency over the specific decade that happens to land on top of someone’s retirement transition.
The second reason is more specific to right now. The wall-of-worry argument works best when the rally itself is broad, when participation is healthy, and when the move reflects collective confidence in the underlying economy. The data above describes something different. A rally where the cap-weighted index outpaces the equal-weight index by a factor of two, where a single sector accounts for the bulk of the gains, where 85% of upward earnings revisions land in four tickers, and where dealer hedging mechanics are visibly part of the price action — that’s not the textbook wall-of-worry climb. That’s a narrower, flow-assisted move that may eventually broaden out into a real one, or may not.
Both possibilities deserve respect. The wall could get climbed. The structure could also crack. Anyone telling you with confidence which way it resolves is selling you something.
That uncertainty is exactly the point on which the next decision turns.
What This Means for the Fragile Decade
Here’s the part that matters for the people I write for.
If you’re 35 and the market is being held up by a narrow group of stocks and a wave of options buying, that’s an interesting condition you’ll read about later. You have decades for the structural questions to resolve. A fragile rally that breaks and recovers is, for you, a buying opportunity. The wall-of-worry argument is built for your timeline — you can afford to be wrong for a while.
If you’re 62 and a large share of your retirement assets is sitting in something with the word “index” in its name, that same structural condition is something else entirely. A diversified-sounding portfolio that is actually carrying a heavy bet on six or seven mega-cap stocks — and on the persistence of options demand — is not the diversification most people think they own. And the timeline that vindicates the wall-of-worry view is no longer working for you the way it works for someone with thirty more years of compounding.
Sequence-of-returns risk doesn’t care whether the loss came from a war, an earnings disappointment, an AI capex pullback, or a mechanical unwind in dealer hedging positions. It cares about the date on the calendar when the loss arrives.
Why the Design Exists
For most of the period the data above covers, this was a market making record highs without showing any real commitment underneath. Equal-weight indexes lagged. Defensive sectors didn’t confirm. Energy was outright down. The percentage of stocks above their 50-day moving average was lower at the recent high than it was at the January high. Earnings upgrades stacked into four tickers. The options gamma channel was doing real work.
In just the last couple of trading days, that has started to shift. Some broader participation has finally shown up. That’s encouraging if it holds.
But notice what that means. For weeks — not days, weeks — the structure was thin. The index was making new records on a skeleton crew. The recovery in participation arrived late, with no advance warning, and we don’t yet know whether it lasts past the next options expiration or the next headline out of the Strait of Hormuz.
This is exactly the environment our investment design was built to handle.
Asset Guidance Group’s Automated Trading System — the rules-based, automated approach we run for retirement accounts, continuously monitors risk signals throughout every trading day, with positioning adjusted daily. It is not designed to predict when narrow markets will broaden out, when call demand will fade, or when a war will end. It is designed to respond to the conditions that actually present themselves, using rules tested across eighteen years of real market history. Continuous monitoring narrows exposure to severe drawdowns. It does not eliminate it — no system does — and we take every measure practicable to keep the math of recovery on the client’s side.
That last point is the whole point. A 50% loss requires a 100% gain to recover. For someone with thirty years of compounding ahead, that math is ugly but survivable. For someone eight years from retirement and starting to draw income, it can be unrecoverable.
The case for a defense-first, rules-based, continuously-adjusting design is not that we know what the market does next. The case is that markets like the one we just lived through — where the headline number disguises the structure underneath, and where the mechanics that lifted the index can reverse on their own schedule — are exactly when retirement money cannot afford to be on autopilot.
But What About the Upside?
The case I just made for the ATS gets read the wrong way sometimes — as if Asset Guidance Group has no view on the upside, no offensive playbook, no answer for clients who do want to bet on the wall getting climbed. None of that is true.
We have an offensive playbook. It just doesn’t go in retirement accounts.
For clients who want AGG-managed exposure to higher-risk, higher-return strategies — with capital they can afford to put at risk — we run GrowthVector, our speculative-account offering, where allocation is currently handled manually. For active traders who want to make their own decisions but want institutional-grade signal work to inform them, we publish PulseSignal Weekly and RegimeSignal Weekly on Substack — paid subscriptions delivering weekly picks with anticipated direction and price targets. These are aggressive products. They are designed for capital that can absorb volatility, and they carry meaningfully higher risk than the ATS approach. They are not appropriate for money you’re going to need in retirement.
The framing we use is short: different money, different jobs.
Retirement money has one job — be there when you need it. That job has an unforgiving math problem behind it, and given the structure the data above just exposed, this is not the moment to be running a 62-year-old’s IRA the way you’d run a 35-year-old’s speculative brokerage account. The post-April 2026 rally has been carried by a narrow group of stocks, concentrated earnings revisions, and dealer hedging mechanics. None of that is the kind of foundation you want under the next decade of retirement income.
Risk capital has a different job. It can take swings. It can absorb a drawdown. That’s where the offensive products belong — and clients who want to speculate in this kind of market should be doing it with capital that’s earmarked for exactly that purpose, not with money that’s funding their retirement.
What we will not do — what no fiduciary should do — is mix those two jobs in the same account because the rally feels good and the upside feels free. The cost of being wrong about that decision shows up at exactly the wrong time, in exactly the wrong account, and the math doesn’t negotiate.
We’re not trying to be the smartest people in the room about the next two weeks. We’re trying to make sure our clients are still in the game when whatever comes next actually arrives — and that the right capital is doing the right job along the way.

Take Action
If you’re reading this in your email, the Like button (the little ❤️ heart icon), the comment section, and the share options are all hiding from you. They only appear on the Substack site itself. Click through to the web version — it takes a second. A like or a share helps The Lighthouse reach more people who need this kind of analysis. You can also subscribe if you’re not already, leave a comment if any of this provoked a reaction, or share this post with someone who’s been wondering whether the record highs feel as solid as they look.
If reading this raised questions about your own portfolio — whether the diversification you think you own is the diversification you actually own, whether your plan accounts for what we’ve been describing — I’d welcome that conversation. Reply to this email, call the office, or schedule a review here. You can also see how our defense-first investment system works at assetguidancegroup.com/ats-mgmt-landing-page-347034. For direct contact: jeeves@assetguidancegroup.company.
Investing involves risk, including the possible loss of principal. This article is for informational purposes only and does not constitute personalized investment advice. Past performance is not indicative of future results.
Wallace R Nichols, MBA, JD, CFP Chief Investment Officer Asset Guidance Group, LLC, a registered investment advisor